Table of Contents
- New Superpowers: Monitoring, Resource Control, and Fine-Tuning
- Better Monitoring and Logging with structlog & Prometheus (v1.5.0)
- Intelligent Resource Management (v1.5.0)
- More Flexibility and Control (v1.6.0)
- Deep Dive: API Scaling with HPA and Prometheus Metrics
- Conclusion: Django and Kubernetes – A Real Dream Team
Meet the Author

2025-08-22
Build scalable Django applications with Django Hurricane and KubernetesDjango Hurricane: Get Your Django Application on Course for Kubernetes
With Django Hurricane, you can develop scalable applications that are a perfect fit for Kubernetes. Learn how to optimize your workflows and harness the full power of modern container orchestration.
Anyone who loves Django appreciates its strengths: rapid development, a robust ORM, and a huge community. But when it comes to deployment in modern, cloud-native environments like Kubernetes, the traditional Django setup hits its limits. This is where Django Hurricane comes in - a project that gets your Django application ready for orchestration.

Prerequisites
You should have the following knowledge to use the article optimally:- Kubernetes Basics
- The Project Django Hurricane
- Kubernetes Probes
- Kubernetes Horizontal Pod Autoscaler
- Optional Google Kubernetes Engine
If you have any questions or if anything is unclear, you can use the comment function below the article.
Django Hurricane integrates concepts like liveness and readiness probes directly into the Django management context. This means Kubernetes can understand the state of your application at any time and react intelligently – for example, by only sending traffic to a new pod when it's truly ready.
But that's just the beginning. The latest updates (versions 1.5.0 and 1.6.0) have introduced a range of powerful new features that make developers' lives even easier. Let's take a closer look at the highlights.
New Superpowers: Monitoring, Resource Control, and Fine-Tuning
The latest versions of Hurricane have focused on giving you more control and better insights into your application – exactly what you need in a dynamic Kubernetes environment.
Better Monitoring and Logging with structlog & Prometheus (v1.5.0)
Good observability is essential for stable systems. Hurricane takes a big step forward here.
Prometheus Metrics Out-of-the-Box
When you start the server via $ python manage.py serve, a metrics endpoint is provided by default at /metrics on the internal port. These metrics are in Prometheus format and can be easily scraped by your monitoring system. This is the foundation for alerts and dashboards. If you don't need this, you can simply disable it with the --no-metrics option. 📈
Structured Logging
As soon as you add structlog to your project, Hurricane integrates automatically. Structured logging is a game-changer because logs are no longer just deserts of text, but machine-readable data. This makes analysis and troubleshooting much easier.
Tip: For users of Google Kubernetes Engine (GKE), it's also recommended to use structlog-gcp to perfectly format logs for Google Cloud Logging.
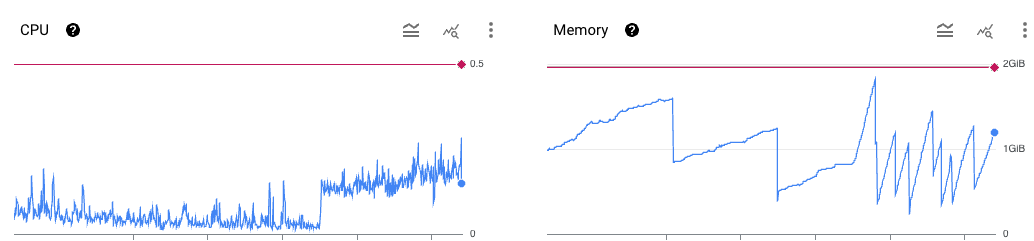
Intelligent Resource Management (v1.5.0)
In a container world, resources like memory are precious and must be managed well.
Set Memory Limit
Set memory limit: With --max-memory, you can set an upper limit for memory usage (e.g., --max-memory 512M). If your application exceeds this limit, it will be restarted in a controlled manner. This prevents uncontrolled crashes due to "Out of Memory" errors and lets Kubernetes control the pod's restart.
Adjust Worker Threads
The --workers option gives you control over the number of threads in the ThreadPoolExecutor. This allows you to optimize performance for I/O-intensive tasks.
More Flexibility and Control (v1.6.0)
Version 1.6.0 focuses on configuration and handling special use cases.
Handling Large Amounts of Data
Does your app process large file uploads or huge JSON payloads? With --max-body-size and --max-buffer-size, you can precisely control the behavior of the underlying Tornado server. This prevents buffer overflows and ensures stability even with high data volumes.
Configuration Your Way
Flexibility is key. Hurricane can now be configured in three ways: classic CLI arguments, entries in the Django Settings, or – and this is especially ideal for Kubernetes deployments – via environment variables. This follows the proven "12-Factor App" principle and allows for clean, environment-specific configurations without code changes.
Deep Dive: API Scaling with HPA and Prometheus Metrics
One of the greatest strengths of Kubernetes is its ability to autoscale. But standard scaling based on CPU or memory utilization is often not ideal for I/O-intensive applications like Django APIs. An API can be under full load (e.g., due to many slow database queries) without a significant increase in CPU load.
A much better metric is the request backlog – the number of requests currently being actively processed by a pod. If this number increases, it means the application is reaching its load limit and we need more instances.
Below, I'll show you exactly how to implement this with Django Hurricane on the Google Kubernetes Engine (GKE).
Step 1: Identify the Right Metric
Django Hurricane provides a variety of metrics via its Prometheus endpoint /metrics. For our use case, a metric like request_queue_length is ideal. It shows us the number of concurrently processed requests per pod. Our goal is to say: "If the average number of active requests per pod is more than 5, start a new pod."
Step 2: Collect Prometheus Metrics in GKE
The easiest way to use Prometheus metrics in GKE is the Google Cloud Managed Service for Prometheus. If this is enabled in your cluster, you just need to tell Kubernetes where to find your application's metrics.
We instruct Kubernetes to scrape metrics from Port 8081 (the internal port of Django Hurricane). Here is an example of a Deployment manifest:
apiVersion: apps/v1
kind: Deployment
metadata:
  name: my-django-api
spec:
  replicas: 2
  selector:
    matchLabels:
      app: my-django-api
  template:
    metadata:
      labels:
        app: my-django-api
    spec:
      containers:
      - args:
        - python /app/manage.py serve --req-queue-len 100 --command "collectstatic
          --no-input" --port 8080 --static --max-memory 950
        name: django-hurricane
        image: your-django-app-image:latest
        ports:
        - containerPort: 8080
          name: http
          protocol: TCP
        - containerPort: 8081
          name: metrics
          protocol: TCP
Then we also need a PodMonitoring:
apiVersion: monitoring.googleapis.com/v1
kind: PodMonitoring
metadata:
  name: my-django-api
spec:
  endpoints:
  - interval: 5s  # Interval to scrape the metrics endpoint
    metricRelabeling:
    - action: keep
      regex: request_queue_.+  # We only export this one metric
      sourceLabels:
      - __name__
    port: metrics  # This is the name of the port (see Deployment above)
  selector:
    matchLabels:
      name: my-django-api  # The Pod Selector
  targetLabels:
    metadata:
    - pod
    - container
With that, the data is already landing in the Google Cloud Console.
Step 3: Create the Horizontal Pod Autoscaler (HPA)
Now comes the most exciting part. We define a Horizontal Pod Autoscaler (HPA) that reads the metric from the Managed Prometheus Service and reacts to it.
The metrics collected by Google Cloud Managed Prometheus receive a special prefix. Our request_queue_length metric will be available in Google Cloud Monitoring as prometheus.googleapis.com|request_queue_length|gauge.
The HPA manifest then looks like this:
apiVersion: autoscaling/v2
kind: HorizontalPodAutoscaler
metadata:
  name: my-django-api-hpa
spec:
  # Description of the scaling behavior
  behavior:
    scaleDown:
      policies:
      - periodSeconds: 15
        type: Percent
        value: 100
      selectPolicy: Max
      stabilizationWindowSeconds: 300
    scaleUp:
      policies:
      - periodSeconds: 15
        type: Pods
        value: 4
      - periodSeconds: 15
        type: Percent
        value: 100
      selectPolicy: Max
      stabilizationWindowSeconds: 0
  # Target deployment to be scaled
  scaleTargetRef:
    apiVersion: apps/v1
    kind: Deployment
    name: my-django-api

  # Scaling limits
  minReplicas: 2
  maxReplicas: 20

  # Metrics used for scaling
  metrics:
  - type: Pods # We are measuring a value per pod
    pods:
      metric:
        # The full name of the metric in Google Cloud Monitoring
        name: "prometheus.googleapis.com|request_queue_length|gauge"
      target:
        type: AverageValue # We are targeting an average value
        averageValue: "5" # Scale up if the average is above 5
What exactly is happening here?
- Django Hurricane delivers: Each pod of your Django application provides the number of active requests at
:8081/metrics. - Prometheus collects: The Managed Prometheus Collector in GKE sees the annotations, regularly scrapes the metrics, and stores them.
- HPA observes: The HPA continuously queries the value for
prometheus.googleapis.com|request_queue_length|gauge. - HPA reacts: It calculates the average value across all running pods. If this value is above our target of 5, the HPA instructs the Deployment to increase the number of replicas (up to a maximum of 20). If the value falls again, pods are elegantly scaled down (to a minimum of 2).
With this setup, you create a highly efficient and responsive API that adapts perfectly to the actual load – all with the built-in tools of Django Hurricane, Kubernetes, and GKE.
Conclusion: Django and Kubernetes – A Real Dream Team
Django Hurricane closes the gap between the developer-friendliness of Django and the operational requirements of Kubernetes. The new features for monitoring, resource management, and flexible configuration make it an indispensable tool for anyone who wants to run scalable and robust web applications in the cloud.
If you want to take your Django projects to the next level, give Django Hurricane a try. Your application – and your DevOps team – will thank you for it.
Do you have questions or an opinion? With your GitHub account you can let us know...
Here are a few articles that you might also find interesting:

django-o365: A Modern Mail Backend for Django and Exchange Online
django-o365 is an open-source mail backend for Django that enables sending emails via Exchange Online using OAuth 2.0. Born from real-world project requirements, this package is aimed at teams using Microsoft 365 who want to implement their email dispatch securely, maintainably, and without workarounds. This article provides an overview of the motivation, features, and usage.


More Blog Articles
Discover exciting insights and practical tips in our latest blog posts. From Python and Rust to Kubernetes, Django security, and frontend topics – find valuable knowledge for your projects here. Click to explore all articles!