Table of Contents
- Why You Absolutely Need Sentry
- Quick Start: How to Integrate Sentry into Django
- Manual Logging
- Best Practices for Clean Error Monitoring
- Understanding the Sentry Dashboard
- Errors and Issues in Detail
- Conclusion

2025-05-19
Optimised error monitoring for Django applicationsEffective error tracking in Django with Sentry
Errors happen in productive environments. And the worst thing is when you only find out about them through the users. This is exactly where Sentry comes into play. One look at the dashboard and you can see what's happening: A clear stack trace, the affected user and how often the error has already occurred.

Why You Absolutely Need Sentry
Errors in live environments can become expensive. If you rely on emails from your users, it's often too late. Sentry brings you real-time error messages directly to your dashboard – including user information, stacktrace, and even environment (Staging, Prod, etc.).
Quick Start: How to Integrate Sentry into Django
1. Install SDK
pip install --upgrade sentry-sdk
2. Create a Project on Sentry.io
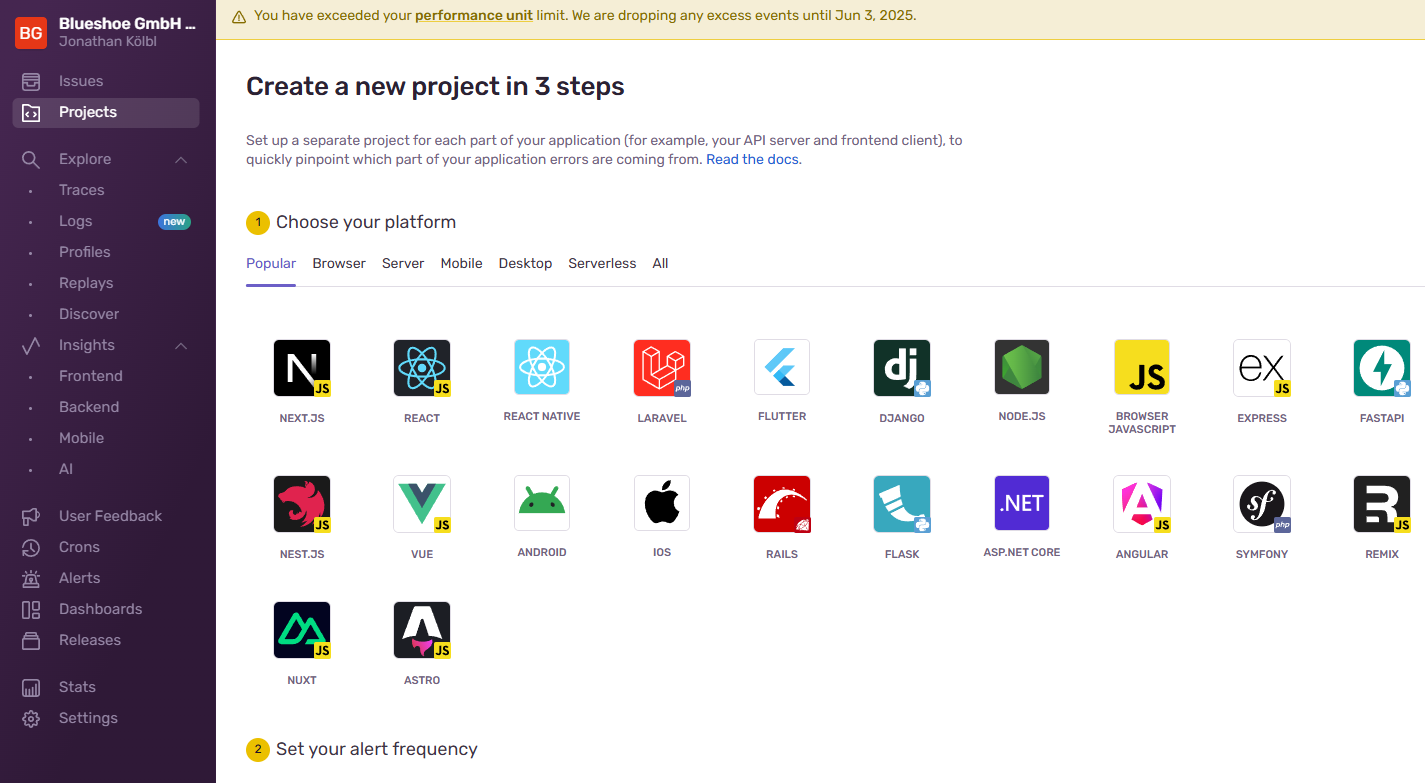 Sign up on sentry.io or log in. Create a new project there and select "Django" as the platform. Sentry will automatically generate a DSN for you, which is a unique URL through which your application sends errors to the right project on Sentry.
Example DSN:
https://examplePublicKey@o0.ingest.sentry.io/0
Copy this DSN and include it in your Django app in the next step.
3. Integrate into settings.py
Integrate the DSN and the basic settings for Sentry into your project. Three parameters are important here:
- dsn: Connects your app to your project on Sentry.
- traces_sample_rate: Indicates what percentage of performance data (e.g., slowness of views) should be collected. At
1.0, all data is captured. For production systems, values like0.2are common to reduce data volume and costs. - send_default_pii: Enables sending personal data (e.g., logged-in users) so you can better track who is affected by an error.
import sentry_sdk
from sentry_sdk.integrations.django import DjangoIntegration

sentry_sdk.init(
    dsn=SENTRY_DSN,
    traces_sample_rate=0.1,
    profiles_sample_rate=0.1,
    environment=SENTRY_ENV,
    default_integrations=False,
    release=VERSION,
    integrations=[
        DjangoIntegration()
    ],
    send_default_pii=True
)
Separating Environments
Especially in larger projects, you want to be able to distinguish whether an error occurs in your development, staging, or production environment. Otherwise, there's a risk that you might mistake error messages generated during tests for live problems.
The environment specification in the Sentry setup helps you separate this cleanly:
ENVIRONMENT = os.getenv("ENVIRONMENT", "development")
You can set this value through environment variables per server. In the Sentry dashboard, you can later filter by environment or create targeted alerts only for production errors.
Manual Logging
To test your first error, you can also manually call Sentry. This is particularly helpful when you want to capture an error in a specific context. For example, if you want to capture an error in a particular function or for a specific user.
try:
    ...
except Exception as e:
    sentry_sdk.capture_exception(e)
With that, the setup of Sentry in Django is complete. You can now monitor errors in your app and get notified immediately when something goes wrong. Great! Now a few tips on how to use Sentry optimally.

We can also improve error tracking in your Django app
Best Practices for Clean Error Monitoring
Once set up, you can get the most out of Sentry with a few tips:
1. Consistently Use Environments
Organize all errors cleanly by production, staging, or development. This way, you can specifically search for problems in the live system – and maintain an overview during tests.
2. Use Release Tags
If you regularly deploy new versions, you should set release="myapp@1.2.3". This helps you recognize if an error has only been occurring since a certain version. Practical for regressions or hotfixes.
3. Activate User Context
Sentry can tell you which logged-in user was affected. This helps tremendously with understanding and debugging.
set_user({"email": user.email})
4. Specifically Ignore Errors
Not every exception is critical. You can create rules in Sentry to filter out 404 errors or specific warnings, for example. This keeps your alert feed organized.
5. Define Alert Rules
Set alerts, e.g., for more than 10 errors in 5 minutes or if a specific environment is affected. These rules can be triggered via Slack, email, or webhook.
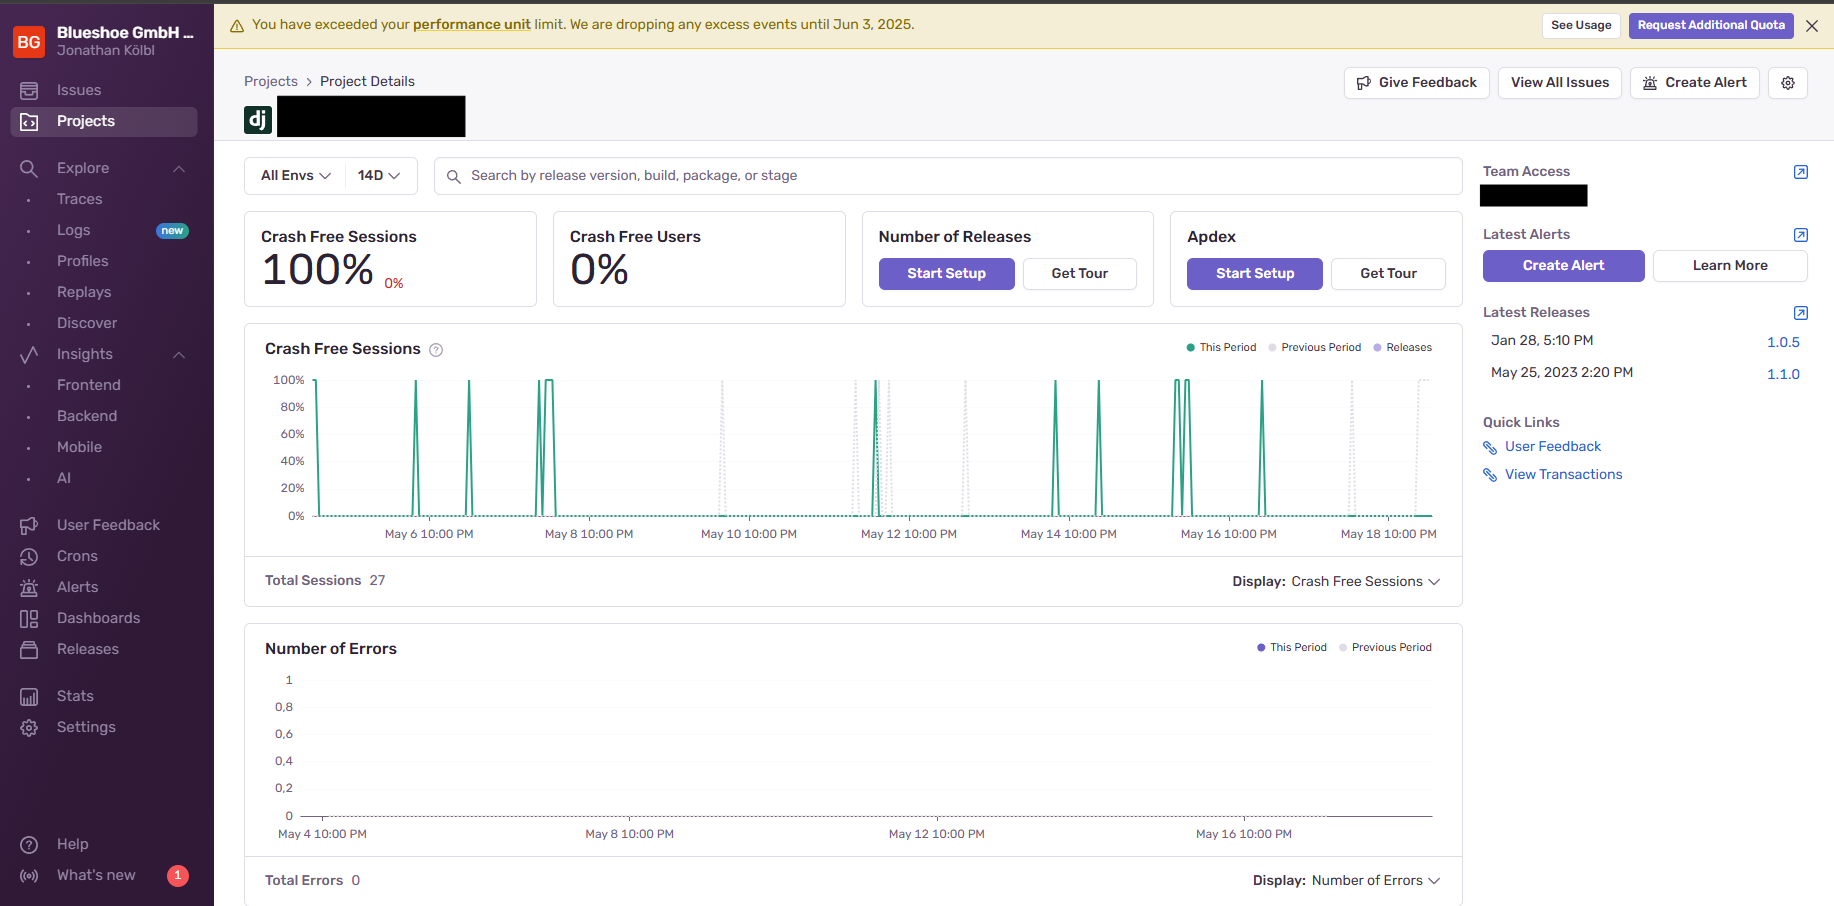
Understanding the Sentry Dashboard
- The dashboard is your central entry point. It immediately shows you:
- New and frequent errors
- Which releases and environments are affected
- The timeline and trends of errors
Here you get an overview of all errors that have occurred in your app. You can filter them by severity, frequency, and environment.
Errors and Issues in Detail
When you click on an error in the dashboard, you get a detailed overview:
- Stacktrace with code lines
- Request context (headers, URL, etc.)
- User data (if activated)
- Link to the affected release
Sentry automatically groups identical errors so you don't have to manually check each individual incident.
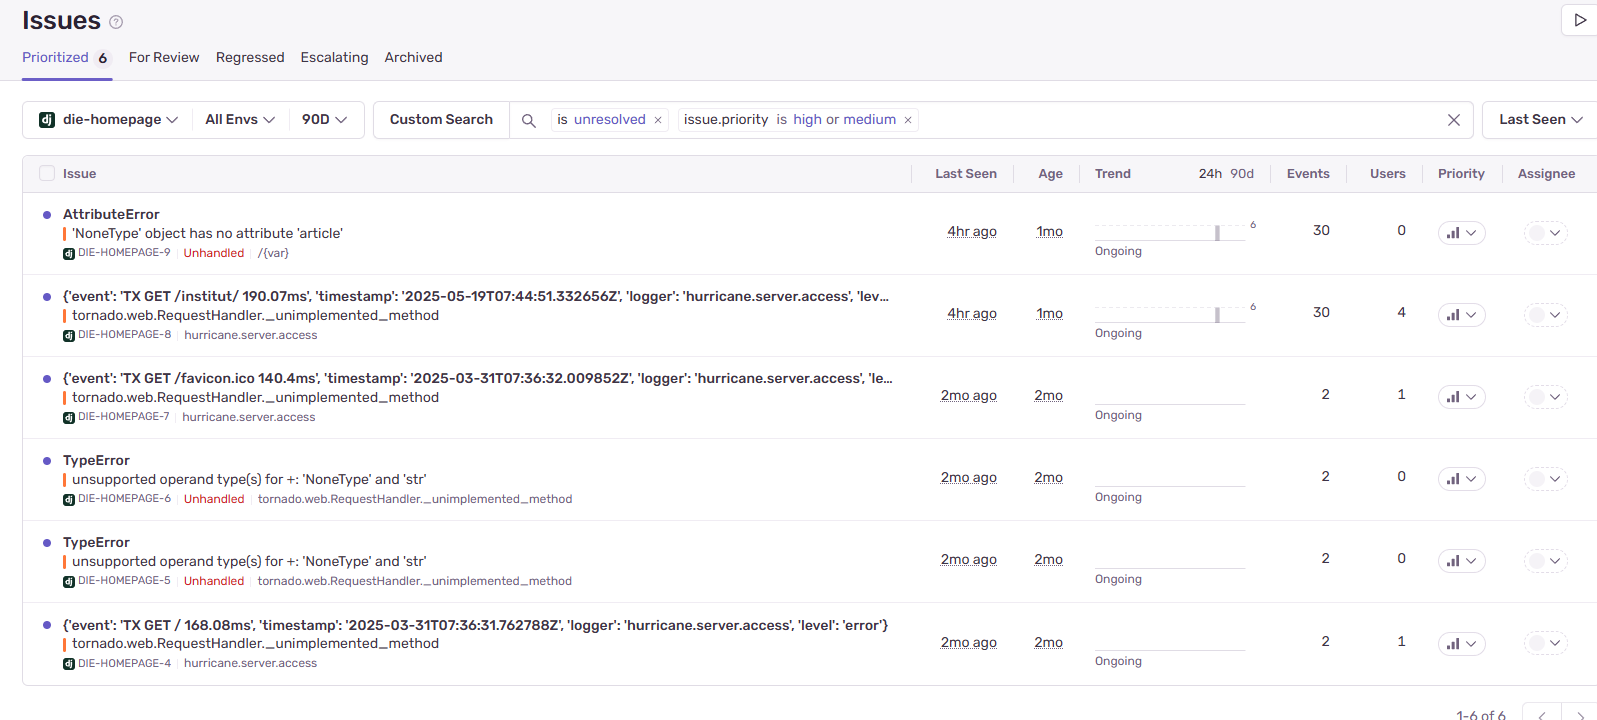 Here you can see at a glance: What is critical? What was last seen? How many users are affected?
Conclusion
With Sentry, you're always immediately informed in case of an error – and can act before it escalates. Setting it up is worthwhile, not only in production but also in staging & dev environments.
Do you have questions or an opinion? With your GitHub account you can let us know...
Here are a few articles that you might also find interesting:

django-o365: A Modern Mail Backend for Django and Exchange Online
django-o365 is an open-source mail backend for Django that enables sending emails via Exchange Online using OAuth 2.0. Born from real-world project requirements, this package is aimed at teams using Microsoft 365 who want to implement their email dispatch securely, maintainably, and without workarounds. This article provides an overview of the motivation, features, and usage.


More Blog Articles
Discover exciting insights and practical tips in our latest blog posts. From Python and Rust to Kubernetes, Django security, and frontend topics – find valuable knowledge for your projects here. Click to explore all articles!