

24.08.2022
Collect logs from across the clusterKubernetes Logging with Promtail, Loki and Grafana
Reading logs from multiple Kubernetes Pods using kubectl can become cumbersome fast. What if there was a way to collect logs from across the cluster in a single place and make them easy to filter, query and analyze? Enter Promtail, Loki, and Grafana.
Introduction (what is this, why do we need it)
By default, logs in Kubernetes only last a Pod’s lifetime. In order to keep logs for longer than a single Pod’s lifespan, we use log aggregation. This means we store logs from multiple sources in a single location, making it easy for us to analyze them even after something has gone wrong. While the ELK stack (short for Elasticsearch, Logstash, Kibana) is a popular solution for log aggregation, we opted for something a little more lightweight: Loki.
Developed by Grafana Labs, ‘Loki is a horizontally scalable, highly available, multi-tenant log aggregation system inspired by Prometheus’. Loki allows for easy log collection from different sources with different formats, scalable persistence via object storage and some more cool features we’ll explain in detail later on. For now, let’s take a look at the setup we created.
Deck
If you just want to take a quick look around, you can use Deck to set up this stack on your machine with one command. After installing Deck, you can run:
$ deck get https://raw.githubusercontent.com/Getdeck/wharf/main/loki/deck.yaml
Follow the instructions that show up after the installation process is complete in order to log in to Grafana and start exploring.
Setup
In this article, we’ll focus on the Helm installation. Grafana Labs offers a bunch of other installation methods.
In Grafana’s Helm chart repository, you’ll find 5 charts related to Loki. Loki-canary allows you to install canary builds of Loki to your cluster. Loki-distributed installs the relevant components as microservices, giving you the usual advantages of microservices, like scalability, resilience etc. while allowing you to configure them independently of one another. Loki-simple-scalable is similar - however, some of the components are always on, taking away a number of the configuration possibilities. The chart named Loki will deploy a single StatefulSet to your cluster containing everything you need to run Loki. The last of the bunch is loki-stack, which deploys the same StatefulSet as the Loki chart in addition to Promtail, Grafana and some others. For our use case, we chose the Loki chart. In addition to Loki itself, our cluster also runs Promtail and Grafana. In the following section, we’ll show you how to install this log aggregation stack to your cluster!
Prerequisites
To follow along, you need a Kubernetes cluster that you have kubectl access to and Helm needs to be set up on your machine.
First of all, we need to add Grafana’s chart repository to our local helm installation and fetch the latest charts like so:
$ helm repo add grafana https://grafana.github.io/helm-charts
$ helm repo update
Once that’s done, we can start the actual installation process.
Loki Installation
Let’s start by getting Loki running in our cluster. To configure your installation, take a look at the values the Loki Chart accepts via the ‘helm show values’ command, and save that to a file.
$ helm show values grafana/loki > loki-values.yaml
We won’t go over the settings in detail, as most values can be left at their defaults. However, you should take a look at the persistence key in order to configure Loki to actually store your logs in a PersistentVolume.
persistence:
    enabled: true
    accessModes:
    - ReadWriteOnce
    size: 10Gi
    annotations: {}
Once you’re done adapting the values to your preferences, go ahead and install Loki to your cluster via the following command:
$ helm upgrade --install loki grafana/loki -n loki -f loki-values.yaml
After that’s done, you can check whether everything worked using kubectl:
$ kubectl get pods -n loki
NAME                            READY   STATUS    RESTARTS   AGE
loki-0                          1/1     Running   0          1h
If the output looks similar to this, congratulations! That’s one out of three components up and running.
Promtail Installation
Next, let’s look at Promtail. Promtail has 3 main features that are important for our setup:
- It discovers targets (Pods running in our cluster)
- It labels log streams (attaching metadata like pod/filenames etc. for easier identification later on)
- It ships them to our Loki instance
To install it, we first need to get a values file, just like we did for Loki:
$ helm show values grafana/promtail > promtail-values.yaml
Like for Loki, most values can be left at their defaults to get Promtail working. However, we need to tell Promtail where it should push the logs it collects by doing the following:
$ kubectl get svc -n loki
NAME            TYPE        CLUSTER-IP       EXTERNAL-IP   PORT(S)    AGE
loki            ClusterIP   10.101.163.181           3100/TCP   1h
We ask kubectl about services in the Loki namespace, and we’re told that there is a service called Loki, exposing port 3100. To get Promtail to ship our logs to the correct destination, we point it to the Loki service via the ‘config’ key in our values file.
config:
 logLevel: info
 serverPort: 3101
 lokiAddress: http://loki:3100/loki/api/v1/push
Under ‘lokiAddress’, we specify that we want Promtail to send logs to ‘http://loki:3100/loki/api/v1/push’. Note that if Loki is not running in the same namespace as Promtail, you’ll have to use the full service address notation like so: ‘
tolerations:
    - key: node-role.kubernetes.io/master
    operator: Exists
    effect: NoSchedule
    - key: node-role.kubernetes.io/control-plane
    operator: Exists
    effect: NoSchedule
If you don’t want Promtail to run on your master/control plane nodes, you can change that here.
Now that we set the most important values, let’s get this thing installed!
$ helm upgrade --install promtail grafana/promtail --namespace=loki -f promtail-values.yaml
Verify that everything worked as expected:
$ kubectl get ds -n loki
NAME       DESIRED   CURRENT   READY   UP-TO-DATE   AVAILABLE   NODE SELECTOR   AGE
promtail   8         8         8       8            8                     1h
You can also take a look at the Pods with the ‘-o wide’ flag to see what node they’re running on:
$ kubectl get pods -n loki -o wide
NAME                            READY   STATUS    RESTARTS   AGE    IP         NODE                     NOMINATED NODE   READINESS GATES
promtail-2j9dj                  1/1     Running   0          1h    1.1.1.1     control-plane-3
promtail-5wjxl                  1/1     Running   0          1h    1.1.1.1     control-plane-1
promtail-9nvps                  1/1     Running   0          1h    1.1.1.1     worker-1
promtail-brgj2                  1/1     Running   0          1h    1.1.1.1     worker-2
promtail-cfnff                  1/1     Running   0          1h    1.1.1.1     control-plane-2
promtail-gtt6m                  1/1     Running   0          1h    1.1.1.1     worker-3
promtail-hnh4z                  1/1     Running   0          1h    1.1.1.1     worker-4
promtail-r4xsz                  1/1     Running   0          1h    1.1.1.1     worker-5
Grafana Installation
Last but not least, let’s get an instance of Grafana running in our cluster.
The following values will enable persistence. If you want your Grafana instance to be able to send emails, you can configure SMTP as shown below. Just add your SMTP host and ‘from_address’ to create a secret containing your credentials.
persistence:
 type: pvc
 enabled: true
 # storageClassName: default
 accessModes:
   - ReadWriteOnce
 size: 10Gi
grafana.ini:
 smtp:
   enabled: true
   host: smtp.smtpserver.io:465
   from_address: grafana@collectallthelogs.io
   skip_verify: true
smtp:
 # `existingSecret` is a reference to an existing secret containing the smtp configuration
 # for Grafana.
 existingSecret: "grafana-smtp"
 userKey: "user"
 passwordKey: "password"
Once you’re done configuring your values, you can go ahead and install Grafana to your cluster like so:
helm upgrade --install loki-grafana grafana/grafana --namespace=loki -f grafana-values.yaml
Verify everything went smoothly:
$ kubectl get pods -n loki
NAME                            READY   STATUS    RESTARTS   AGE
loki-grafana-64b4b79494-8bt7c   1/1     Running   0          1h
All three components are up and running, sweet! Now that we’re all set up, let’s look at how we can actually put this to use.
OUR KUBERNETES PODCAST
Tools for the Craft: Navigating the Kubernetes ecosystem
Michael and Robert are talking in depth about the ins and outs of local Kubernetes development and also provide some real coding examples.
More editions of our podcast can be found here:
Show moreUsage
Connecting your newly created Loki instance to Grafana is simple. All you need to do is create a data source in Grafana. Under Configuration → Data Sources, click ‘Add data source’ and pick Loki from the list. You’ll be presented with this settings panel, where all you need to configure, in order to analyze your logs with Grafana, is the URL of your Loki instance. Since Grafana is running in the same namespace as Loki, specifying ‘http://loki:3001’ is sufficient.
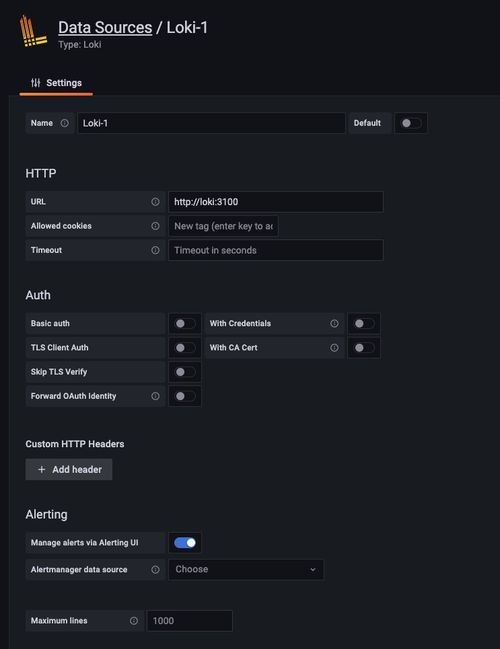
When you’re done, hit ‘Save & test’ and voilà, you’re ready to run queries against Loki.
LogQL
‘LogQL is Grafana Loki’s PromQL-inspired query language. Queries act as if they are a distributed grep to aggregate log sources. LogQL uses labels and operators for filtering.’
With LogQL, you can easily run queries against your logs. You can either run log queries to get the contents of actual log lines, or you can use metric queries to calculate values based on results.
LogQL is well-documented, so we won’t go into detail about every feature, but instead give you some queries you can run against your logs right now in order to get started. Go to the Explore panel in Grafana (${grafanaUrl}/explore), pick your Loki data source in the dropdown and check out what Loki collected for you so far.
Simple Log Query
If you just want logs from a single Pod, it’s as simple as running a query like this:
{pod="loki-0"}
Grafana will automatically pick the correct panel for you and display whatever your Loki Pod logged.
Errors across a namespace
This query will filter logs from a given namespace that contain the word ‘error’ It will count them over the range selected in the dashboard and return the sum, giving you a simple overview of what’s going on across your cluster.
sum(count_over_time({namespace="loki"} |= "error" [$__range]))
Average response time in a namespace, by path and app
This query is as complex as it will get in this article. It collects logs from a namespace before applying multiple neat features LogQL offers, like pattern matching, regular expressions, line formatting and filtering. In the end, you’ll receive the average response time of apps running in the given namespace within the selected interval. You’ll effectively be filtering out the log lines that are generated by Kubernetes liveness and readiness probes, grouped by app label and path. Note: this exact query will work for Django Hurricane’s log format, but you can tweak it by changing the pattern to match your log format.
avg_over_time({namespace="application"} | pattern " Other Features/Further Reading/Caveats
If you don’t want to store your logs in your cluster, Loki allows you to send whatever it collects to S3-compatible storage solutions like Amazon S3 or MinIO. The log analysing/viewing process stays the same.
File system storage does not work when using the distributed chart, as it would require multiple Pods to do read/write operations to the same PV. This is documented in the chart repo, but it’s sadly not mentioned in Loki’s official documentation.
LogCLI is Loki’s CLI tool, allowing you to easily browse your logs from the comfort of your terminal. This requires you to expose your Loki instance via http or use port forwarding from your cluster to your machine.
Do you have questions or an opinion? With your GitHub account you can let us know...
Here are a few articles that you might also find interesting:

How to: Custom configurations for ingress-nginx with kustomize
Ingress-nginx is one of the most popular ingress controllers for Kubernetes. In this blog post, we show how one can adjust the ingress-nginx K8s resources and easily persist them using kustomize. This makes installation and updates simpler and less error-prone.

StrongSwan VPN in Kubernetes: Securely Integrate External Services
In some cases, a VPN connection to an external service is needed - which can be tricky with Kubernetes. In this article, we show how to set up an IPsec tunnel with StrongSwan. From Kubernetes to an external service using Nginx as a reverse proxy. The setup is clearly structured, easily maintainable, and dynamically distinguishes between staging and production environments.

Kubernetes Backup in Storage Buckets
We use not only Kubernetes, but also Cloud Storage, Cloud SQL, and GitHub Actions to run – and secure – our applications efficiently. In this article, we’ll show you how to implement a reliable Kubernetes backup strategy to protect your databases, media, and code from data loss.

Gefyra Roadmap 2025
Gefyra has big plans for 2025! From improved developer tools to new integrations and better performance – the roadmap is packed with exciting updates. In this blog post, we’ll walk you through what’s coming and how Gefyra aims to keep revolutionizing development and debugging in Kubernetes. Stick around for a glimpse into the next chapter!

Cost Optimization of an Azure Kubernetes Cluster
Cloud resources are powerful and practical, but expensive - especially Kubernetes clusters. In this blog post, we show how we successfully implemented Azure Kubernetes Service Cost Optimization in a existing project. We present strategies, tools, and best practices that helped reduce AKS costs without compromising performance.

Efficient Runtimes with KEDA: Dynamic Autoscaling for Kubernetes Clusters
Kubernetes is performance-strong, but without optimized operating times, unnecessary resources and costs can arise. KEDA (Kubernetes Event Driven Autoscaling) enables dynamically scaling workloads and pausing them outside defined operating times. In this blog post, we show how you can adapt your cluster to work times – for more efficiency and reduced hosting costs.