Table of Contents

2021-07-07
Let's go Cloud Native!How does local Kubernetes development work?
'Local Kubernetes development' aka 'development of containerised microservices in a local Kubernetes cluster' means that applications are designed and developed for a Kubernetes architecture – i. e. a developer works with a Kubernetes architecture locally. In this blog post, we’ll show you how local Kubernetes development works.
Prerequisites
‘Local Kubernetes development’ – or rather, ‘How can I stuff as many tech buzzwords into a short blog article as possible?’ One might also want to pop in the term ‘K8s’ somewhere, which is used as an abbreviation for ‘Kubernetes’ … but let’s not go crazy here. In order to understand this blog post, we’ll assume you have a basic understanding of Kubernetes. If that’s not the case, we can recommend this Comic by Google:

Let’s assume you’re developing a new project. You’ve identified a few independent services along the way and have now decided that it would make sense to deploy these in separate containers and have them orchestrated by Kubernetes. As it’s a bigger project, several programmers are working on it – and they’re only working on one of the services each, either individually or in small teams.
Status Quo
The project example described above has now become a pretty common scenario. How can we now ensure that our programmers are also able to use their own laptops to develop as closely to the Kubernetes architecture as possible? A common method of running Docker containers locally is docker-compose. While this one’s especially easy to manage, it does have one major drawback: a docker-compose set-up doesn’t display the eventual production environment, i.e. the Kubernetes set-up. The worst-case scenario would be that you’ve programmed something which functions locally in your docker-compose set-up but not in the production system due to the image being run differently here.
As an alternative, technologies have been developed which simulate Kubernetes clusters on local computers. Minikube is a pretty widespread solution, but there are also more and more other alternatives which have been gaining ground in recent times. Some of those worth mentioning are microk8s by Canonical, for example, or k3s and k3d by Rancher which are more resource-efficient. K3d uses k3s to simulate more Worker Nodes in the local Kubernetes cluster. Usually, kubectl is then used for the interaction with the cluster.
As a developer, you now simply have to build a Docker image of your service and make it available to your colleagues. They can deploy the image in their local cluster and will then have local access to the most up-to-date status of your service.
Two exciting challenges still remain at this point, however:
- How can I work on my service and always have the up-to-date status available in my cluster without having to build and deploy a new image?
- How can I use the debugger locally?
How does local Kubernetes development work?
In the upcoming sections, we will have a look at how we overcome these challenges concerning local Kubernetes development. For this, we’ll be using k3d as a local Kubernetes cluster as well as PyCharm as our development environment. We’ll also be using Helm for the cluster management as well as Telepresence to manage the live code reloading. The following installation examples were all carried out on an up-to-date Ubuntu system.
Local Kubernetes Development using Gefyra
Gefyra is an Open Source intiative that aims to make local Kubernetes Development super fast and rock solid while providing you with all the Kubernetes features you love locally. Check my talk at Conf42 about how I locally debug container with a sidecar using Gefyra.
You can check out Gefyra here:
Show me GefyraK3D/K3S – Lightweight Kubernetes in Docker
k3d can be installed very easily by using the installation script provided by Rancher:
wget -q -O - https://raw.githubusercontent.com/rancher/k3d/master/install.sh | bash
The installation of k3s is just as simple:
wget -q -O - https://raw.githubusercontent.com/rancher/k3d/master/install.sh | bash
A new cluster can be created with the following command (we use k3d version 4 here):
k3d cluster create buzzword-counter --agents 1 -p 8080:80@agent[0] -p 31820:31820/UDP@agent[0] --registry-create
Here we have created a cluster called buzzword-counter and, amongst other things, have mapped the local port 8080 on the cluster’s internal port 80 so that we can access our cluster in the web browser via port 8080. Additionally we mapped port 31820, which we later need for Gefyra. We also enable local Docker images to be deployed in the cluster using the flag --registry-create, which creates a local registry named k3d-buzzword-counter-registry. We need an entry in our /etc/hosts file for the local registry:
[...]
127.0.0.1     k3d-buzzword-counter-registry
[...]
The correct kubectl context has been set by k3d, which we can verify by running kubectl config current-context.
In order for us to be able to interact with our cluster using kubectl, we can either export the KUBECONFIG environment variable or integrate the content of the respective file in ~/.kube/config:
export KUBECONFIG="$(k3d get-kubeconfig --name='buzzword-counter')"
Helm – Kubernetes Package Manager
We often use Helm to manage our Kubernetes cluster. Helm describes itself as a package manager for Kubernetes and it also enables the mapping of complex Kubernetes applications in templates. Here, the buzzword is ‘infrastructure as code’. Thanks to the templates, our application can be deployed into a new Kubernetes cluster at any time and without any major effort. To install Helm, you can simply download a binary file: to the download
Example deployment: Buzzword counter
To show you a practical example, we have created a simple deployment for this blog post and put it up on Github:
This deployment includes a simple Django application, a Celery distributed task queue with rabbitmq as message broker to process asynchronous tasks as well as a PostgreSQL databank. With our application, we can count buzzwords and add new ones, too. The adding of buzzwords is implemented as a Celery task – in this example, it’s pretty pointless, but it demonstrates the functionality of our Celery distributed task queue perfectly.
The first step of the deployment is to deploy the application as a Docker image. As we want to push it to our local registry, we need to find out its mapped port by running docker ps -f name=k3d-buzzword-counter-registry. In our case it is port45319. Now we build the Docker image (from the Django application’s directory) and push it into our local registry:
docker build -t k3d-buzzword-counter-registry:45319/buzzword-counter:0.1.0 .
docker push k3d-buzzword-counter-registry:45319/buzzword-counter:0.1.0
With the following commands (from the Helm charts’ directory), the application is installed and configured in the Kubernetes cluster with the PostgreSQL and RabbitMQ dependencies.
helm repo add bitnami https://charts.bitnami.com/bitnami
helm dep update buzzword-counter
helm install buzzword-counter buzzword-counter/
It might take a couple of minutes until everything is ready. Via kubectl, we can see whether the pods are available, for example, or we can have the log output displayed and verify that the runserver was started on the web pod and the celery worker on the worker pod:
kubectl get deployments
kubectl get pods
kubectl logs -f buzzword-counter-web-XXXXX-XXXXXXXX
kubectl logs -f buzzword-counter-worker-XXXXX-XXXXXXXX
As we use nip.io, we can simply access our service under http://buzzword-counter.127.0.0.1.nip.io:8080. If DNS Rebinding doesn’t work or isn’t allowed on your local setup and therefore you can’t use nip.io, you need to add an entry to your /etc/hosts in order to access the url:
[...]
127.0.0.1       buzzword-counter.127.0.0.1.nip.io
[...]
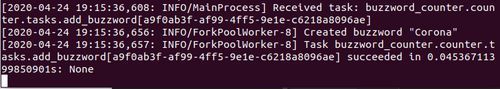
If we start a task, we can check out its output in the worker pod’s log via kubectl.
kubectl logs -f buzzword-counter-worker-XXXXX-XXXXXXXX
Gefyra - Fast, local development for Kubernetes
In order to access live code reloading, i. e. to make code changes done in our IDE immediately available in the cluster, we use Gefyra. Without live code reloading, we have to build a new Docker image and deploy it in the cluster after every change – which is pretty inconvenient and can become very time-consuming. Please follow the instructions to install Gefyra.
To make our local code available in the cluster we need to run following commands, you need to adapt the path in LOCAL_DIR to the directory of your local buzzword-counter copy:
docker build -t buzzword-counter:dev .
    gefyra up
    export LOCAL_DIR=/home/<...>/buzzword-counter
    gefyra run -i buzzword-counter:dev -N buzzword-dev -n default -v $LOCAL_DIR:/code --env-from buzzword-counter-web-69d98bb99d-62p4q/buzzword-counter -c "python manage.py serve --port 9000 --static --autoreload --debugger --debugger-port 5678"
gefyra bridge -N buzzword-dev -n default --deployment buzzword-counter-web --port 9000:9000 --container-name buzzword-counter -I buzzword-bridge
Let’s go over it in more detail. First, we built our development image.
Then we initialized gefyra in the cluster and executed our image with gefyra run, to make it part of the cluster. We can see it running with docker ps. Additionally we mounted the local source code directory into the container and specified that the new container should copy the environment from container buzzword-counter of pod buzzword-counter-web-69d98bb99d-62p4q. You need to change it appropriately to the name of the pod that’s running in your cluster, if you’re following these steps. We start the container with Hurricanes serve command with the autoreload flag and two flags for debugging, which we need later on.
Finally, we created a bridge with gefyra bridge in order to intercept the traffic to the cluster application with the one running locally.
By visiting http://buzzword-counter.127.0.0.1.nip.io:8080/, we can now observe that code changes in our local IDE are available in the cluster. Keep in mind that only changes in a non-template file trigger the reload.
Attaching a Debugger with Gefyra
Now that we have our local code running in the Kubernetes cluster, we only need one more essential thing for a convenient developer workflow: attaching a debugger to interactively debug our application. We can achieve this with Gefyra too, that’s why we’ve added the debug-flags to Hurricanes serve command. We’re using VSCode with the Python extension installed.
In order to set it up, we need to find out the local IP address of the container we started with gefyra run:
docker inspect -f '{{range.NetworkSettings.Networks}}{{.IPAddress}}{{end}}' buzzword-dev
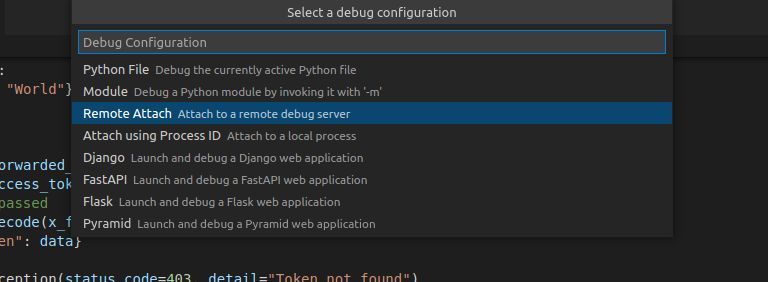
This will be part of the CLI soon (as of April 2022, maybe it already is). The command shown tells the IP of the container which is needed for VSCode. Next we open the buzzword-counters source code in VSCode and select the Remote Attach option to connect to the running debugpy instance at the given IP. The port is 5678, which we specified in the gefyra run command.
Upon starting the debugger, the output shows the following:
2022-04-29 06:26:34,683 hurricane.server.general INFO     Tornado-powered Django web     server
2022-04-29 06:26:34,688 hurricane.server.general INFO     Autoreload was performed
2022-04-29 06:26:34,688 hurricane.server.general INFO     Starting probe application running on port 9001 with route liveness-probe: /alive, readiness-probe: /ready, startup-probe: /startup
2022-04-29 06:26:34,695 hurricane.server.general INFO     Starting HTTP Server on port 9000
2022-04-29 06:26:34,695 hurricane.server.general INFO     Serving static files under /static/ from /code/buzzword_counter/../static
2022-04-29 06:26:34,697 hurricane.server.general INFO     Startup time is 0.014339923858642578 seconds
We can now set breakpoints and start debugging our code. And with that we have achieved not only cloud native development but debugging too!
Telepresence: Another option for local development
[This section was originally written in March 2020 with Telepresence 1. In the meantime Telepresence 2 has been released. Please refer to their documentation or check out our comparison of Telepresence 2 and Gefyra.]
Another solution for local Kubernetes development ist Telepresence. It is a so-called sandbox project by the CNCF, the Cloud Native Computing Foundation. With Telepresence (v1), you can run a locally built Docker image in a cluster by ‘swapping’ a deployment.
This is pretty spectacular from a technical point of view. However, for this post, it’ll be sufficient to use a command to swap the buzzword counter web deployment of our Kubernetes cluster and run the specified Docker image instead. First, though, we’ll have to create the Docker image. For both commands, we’ll have to be in the directory of our Django application’s source code:
docker build -t buzzword-counter:local .
telepresence --swap-deployment buzzword-counter-web --expose 8080 --docker-run --rm -it -v $(pwd):/code buzzword-counter:local python manage.py runserver 0.0.0.0:8080
What’s more, we have mounted the current directory in the Docker container using the flag ‘-v $(pwd):/code’ so that the code changes in PyCharm are also available in the Kubernetes cluster. However, as we’re using the Django runserver, the live reloading will only work if the DEBUG=True has been set up. We can either deploy this via the Helm charts or simply export it in our swapped deployment. Afterwards, we’ll run the run script:
export DJANGO_DEBUG=True
/usr/src/run_app.sh
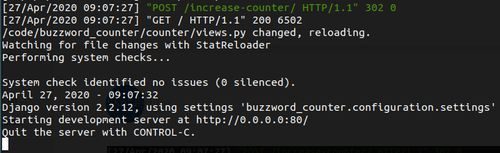
If we swap the container, we have to run the three above-mentioned commands again for the port-forward of the pod. Afterwards, we can change the code in PyCharm and verify that the runserver was restarted – either in the log or by opening the page in a browser.
Have a closer look and you’ll find that Telepresence is not limited to a local Kubernetes cluster. You can also swap deployments from remote clusters as long as they can be accessed via kubectl. This can be very useful for the debugging and tracing of bugs on test systems, for example. Caution is advised, however, as every deployment traffic is directed to the local laptop after the swap. That means that this approach is only really suited to test systems and should be avoided at all costs in the case of most production systems.
Python remote debug in PyCharm
So now we can deploy our application in the local Kubernetes cluster with live code reloading. We have accomplished our buzzword mission, the production environment (i. e. Kubernetes development environment) has been replicated locally and we can carry out Cloud Native developments on our service. The icing on the cake now is to configure the PyCharm Debugger in a way that we can also debug our application directly in PyCharm. To do this, we first have to configure Python remote debug in PyCharm:
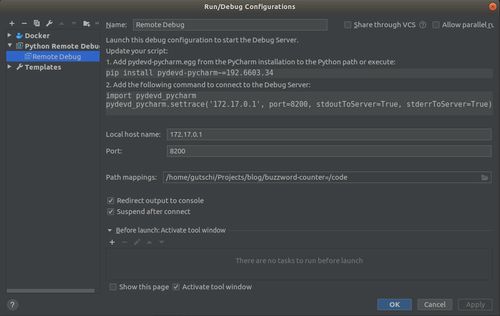
Do bear in mind that it’s crucial that an absolute path is specified in the path mapping (the ~ shortcut for the home directory doesn’t work). As you can see in the image above, the configuration also needs a specific version of the Python package pydevd-pycharm.
In order to avoid this package being unnecessarily part of our production deployment, we’re creating a second Dockerfile which installs upgraded pip requirements. Furthermore, we’ve added a simple view to our application (in urls.py) so that we can conveniently establish a connection between our cluster and the PyCharm Debugger via URL. What’s important here is that the IP address and the port match the configuration in PyCharm.
docker build -f Dockerfile.dev -t buzzword-counter:debug .
telepresence --swap-deployment buzzword-counter-web --expose 8080 --docker-run --rm -it -v $(pwd):/code buzzword-counter:debug bash
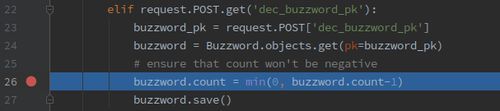
Afterwards, we browse the Debug-URL. Here, too, we have to remember that DEBUG=True has been set up and that we have carried out the port-forward. Now we can already set up a breakpoint in PyCharm. If we browse the respective view, the application will be stopped by the debugger and we can then inspect why a reduction of the counter either resets it to 0 or why we even get an IntegrityError:
Tools for the Craft - Edition 1: Kubernetes development environments
You can also check out the first edition of our Kubernetes podcast "Tools for the Craft: Navigating the Kubernetes ecosystem" here. Michael and Robert are talking in depth about the ins and outs of local Kubernetes development and also provide some real coding examples.
More editions of our podcast can be found here:
More podcast editions!Conclusion
Thanks to the tools k3d/k3s, Helm, Gefyra and additional debugging courtesy by Hurricane, we’ve conquered the mountain called ‘Local Kubernetes development’. Our developers can now develop in their own local Kubernetes cluster. A particularly practical solution to local Kubernetes development is Gefyra in combination with Hurricanes debugging support.
Still, it has to be noted that the handling of the tools isn’t quite that simple and that it does take some time to get used to them. The obstacle is particularly big in comparison with docker-compose. If you are looking for that kind of convenience and a team oriented workflow, check out Unikube, which combines all needed tools for effortless local kubernetes development.
And finally, let’s not forget the buzzword counter: I got to 23 unique buzzwords in total. Did you count along and get to a different number? Go on then, let us know.